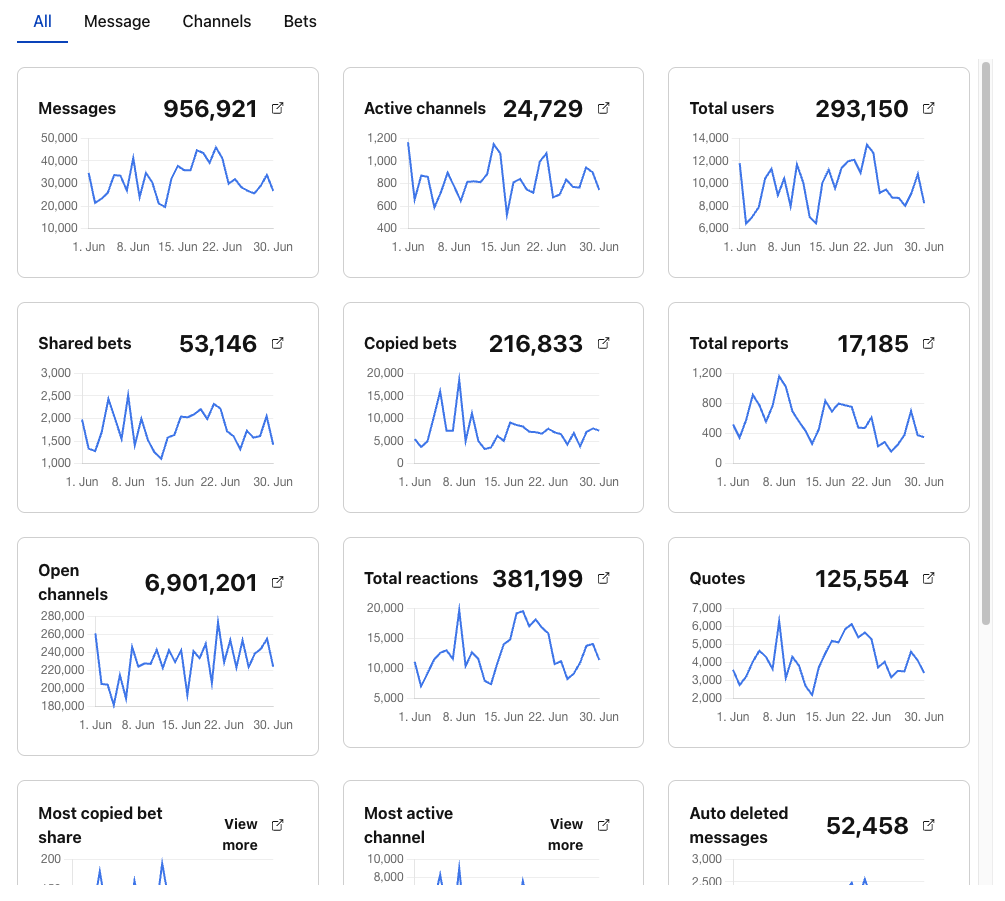
The Analytics section provides you with insights and statistics about your organization's activity. You can view, filter, and analyze data to help you understand trends and performance across your Virtual Stadium moderation operations.
info
All statistics pertain to the chosen operator. To view data for a different operator, simply select it from the left side dropdown menu.
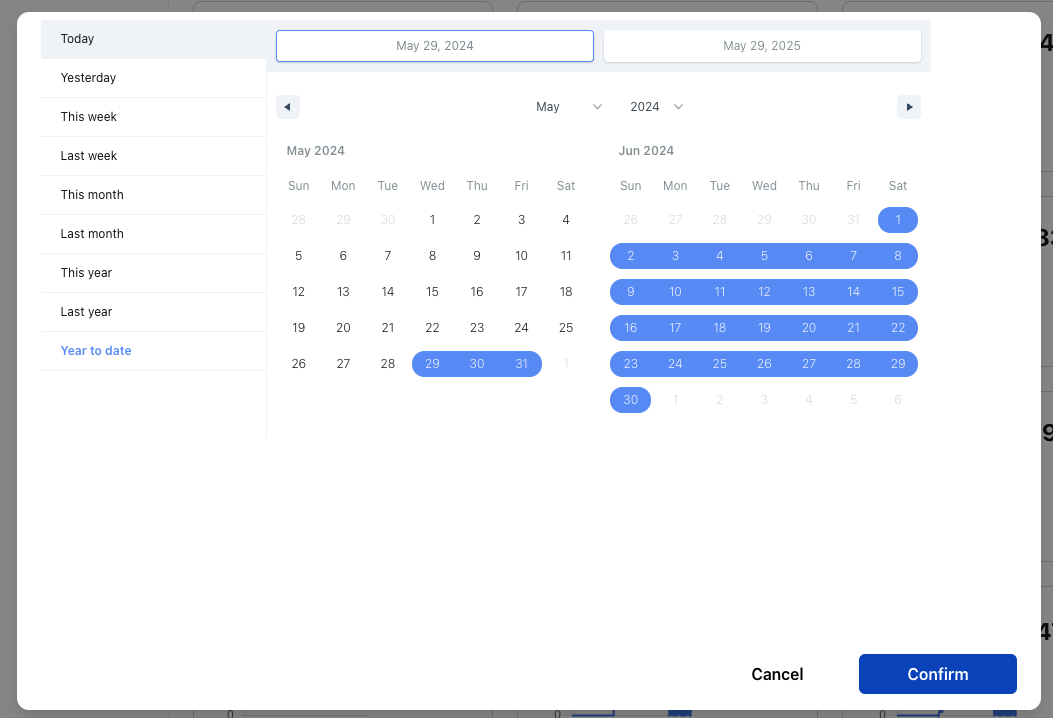
#Adjusting Time Period
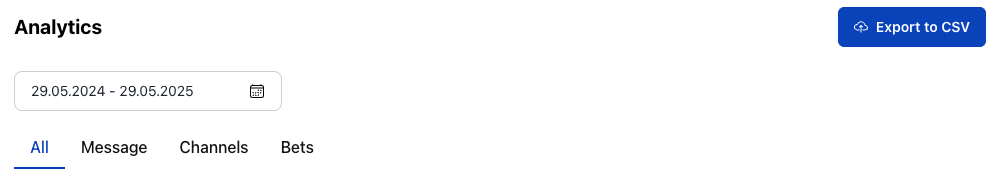
Use the date range selector at the top to choose the period you want to analyze.
You can view up to 31 days of analytics.
#Switch Between Tabs
Use the tabs to view different types of analytics:
- All: See an overview of all available statistics.
- Message: Focus on message-related analytics.
- Channels: View analytics by channel.
- Bets: See statistics related to bets.

#View Analytics Data
The analytics grid displays key statistics for the selected period and tab. Each grid item shows a summary and a chart for that metric.
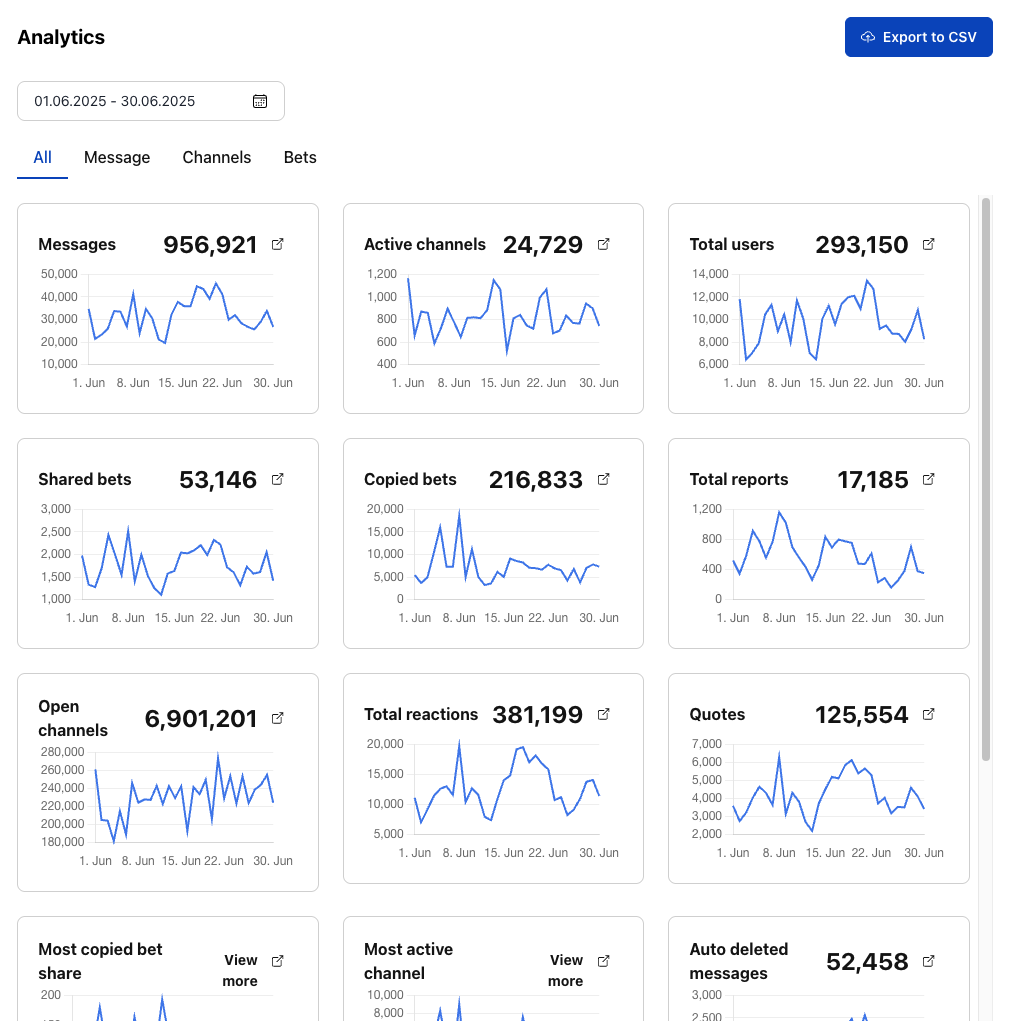
#Key Metrics
#Message Analytics
- Total Messages: Volume of chat activity across all channels
- Moderated Messages: Content that required moderation intervention
- User Engagement: Active users and participation rates
- Response Times: Speed of moderation actions
#Channel Analytics
- Active Channels: Number of channels with activity
- Channel Performance: Message volume and engagement per channel
- Peak Activity: Busiest times and channels
- Channel Growth: New channels created and usage trends
#Betting Analytics
- Shared Bets: Number of bets shared in chat
- Bet Engagement: User interaction with shared betting content
- Popular Markets: Most discussed betting topics
- Conversion Metrics: Chat engagement impact on betting activity